Market Outlook
February 27, 2017
Market Cues
Domestic Indices
Chg (%)
(Pts)
(Close)
Indian markets are likely to open flat tracking the SGX Nifty.
BSE Sensex
0.1
28
28,893
US Markets closed up with the Dow index posting a new record closing high. The
Nifty
0.1
13
8,940
Commerce Department released a report showing that new home sales climbed by
Mid Cap
0.2
25
13,532
3.7 percent to an annual rate of 555,000 in January against an expectation of an
Small Cap
0.1
15
13,588
increase of 7.5 percent. Consumer sentiment pulled back by less than expected. The
consumer sentiment index for February was upwardly revised to 96.3 from a
Bankex
0.1
18
23,825
preliminary reading of 95.7 against an expectation of 96.0.
The European markets ended Friday's session extending the losses for the week as
Global Indices
Chg (%)
(Pts)
(Close)
weak corporate earnings dampened investor sentiment. Among UK stocks financials
Dow Jones
0.1
11
20,822
were weak with Standard Chartered dropping 2.73 percent after its annual profit
Nasdaq
0.2
10
5,845
missed analyst estimates. Royal Bank of Scotland Group dropped 4.49 percent as it
FTSE
(0.4)
(28)
7,244
posted a £7bn annual loss, due to misconduct charges and restructuring costs.
Nikkei
(1.4)
(277)
19,006
Indian markets opened positive but lost most of the gains of the session to close
Hang Seng
(0.2)
(43)
23,923
mildly positive. The Telecom sector was in focus with Bharti Airtel climbing 1.4
Shanghai Com
(0.2)
(7)
3,246
percent, after news that it had taken over Telenor's India operations. Idea Cellular
rallied 6.39 percent on news that Softbank Corp might pick up a minority stake in
the proposed Idea-Vodafone merger. IT stocks also performed well, with the IT index
Advances / Declines
BSE
NSE
closing up 1.7 percent.
Advances
1,205
666
Declines
1,588
984
News Analysis
Unchanged
189
61
L&T arm wins `1,100cr contract from IOC
Detailed analysis on Pg2
Volumes (` Cr)
Investor’s Ready Reckoner
BSE
3,278
Key Domestic & Global Indicators
NSE
33,091
Stock Watch: Latest investment recommendations on 150+ stocks
Refer Pg5 onwards
Net Inflows (` Cr)
Net
Mtd
Ytd
FII
252
8,908
8,862
Top Picks
CMP
Target
Upside
MFs
887
(23)
5,192
Company
Sector
Rating
(`)
(`)
(%)
Amara Raja Batteries Auto & Auto Ancillary
Buy
846
1,009
19.2
Top Gainers
Price (`)
Chg (%)
HCL Tech
IT
Buy
843
1,000
18.7
Idea
120
6.4
Power Grid Corp.
Power
Accumulate
199
223
12.0
Jindalstel
117
5.9
Navkar Corp.
Others
Buy
161
265
64.3
Jpassociat
15
5.8
KEI Industries
Others
Buy
172
207
20.3
More Top Picks on Pg3
Edelweiss
135
5.4
Amtekauto
38
5.0
Key Upcoming Events
Previous
Consensus
Date
Region
Event Description
Reading
Expectations
Top Losers
Price (`)
Chg (%)
Feb 27 US
New home sales
536.00
570.00
Il&Fstrans
99
(3.0)
Feb 28 US
Consumer Confidence
111.80
110.90
Unitdspr
2,333
(2.7)
Mar 01 Germany Unemployment change (000's)
(26.00)
Raymond
559
(2.6)
Mar 01 US
GDP Qoq (Annualised)
1.90
2.10
Mar 01 Germany PMI Manufacturing
57.00
Repcohome
664
(2.5)
Mar 01 UK
PMI Manufacturing
55.90
Ramcocem*
653
(2.5)
More Events on Pg4
As on February 23, 2017
Market Outlook
February 27, 2017
News Analysis
L&T arm wins `1,100cr contract from IOC
Larsen and Toubro Hydrocarbon Engineering has won orders worth `1,100cr from
Indian Oil Corporation (IOC) for its Bongaigaon refinery in Assam. The orders are
for IOC's Indane Maximisation project, under which it will set up a fluidised
cracking unit including LPG treatment facility.
The company won an onshore EPC contract from IOC worth around `1,100cr for
setting up a 0.740 MMTPA Fluidised Cracking Unit (FCU) including LPG treatment
facility at their Bongaigaon refinery, Assam. The contract covers extended basic
engineering, detailed engineering, procurement, supply, transportation and
installation, among others.
L&T operates in over 30 countries, and is engaged in technology, engineering,
construction, manufacturing and financial services. Larsen and Toubro
Hydrocarbon Engineering Ltd is a wholly-owned subsidiary of engineering major
L&T. We have an ACCUMULATE rating on Larsen & Toubro with a target of
`1,634.
Economic and Political News
India to be fastest-growing economy in G-20: Moody's
India signs `17,000cr deal to jointly develop a medium-range surface-to-air
missile with Israel
India's steel exports up three times YoY in January
Employees' Provident Fund Organisation to launch a housing scheme to
enable members to make down payment and pay EMIs from their EPF
accounts
Wind power tariff likely to go below `4 per unit
Corporate News
ONGC to invest `7,327cr in four oil and gas projects
Hindalco plans to invest `500-700cr on de-bottlenecking its Utkal alumina
refinery
Sun Pharma Advanced Research Company (SPARC) receives a demand notice
from income tax authorities for a sum of around `33cr
Tata Steel’s Haldia plant receives environment clearance (EC) for capacity
expansion
Market Outlook
February 27, 2017
Top Picks
Large Cap
M
arket Cap
CM
P
T
arget
Upsid
e
Company
Rationale
(` Cr)
(`)
(`)
(%)
To outpace battery industry growth due to better
Amara Raja Batteries
14,458
846
1,009
19.2
technological products leading to market share gains in both
the automotive OEM and replacement segments.
The stock is trading at attractive valuations and is factoring
HCL Tech
1,18,908
843
1,000
18.7
all the bad news.
Back on the growth trend, expect a long term growth of 14%
Infosys
2,31,773
1,009
1,249
23.8
to be a US$20bn in FY2020.
Strong order backlog and improvement in execution would
Larsen & Toubro
1,38,643
1,486
1,634
10.0
trigger the growth for the L&T
One of the largest pharma companies with strong
Lupin
65,618
1,453
1,809
24.5
international presence. It has a rich pipeline of ANDAs which
is also one of the largest among the generic companies.
Going forward, we expect the company to report strong
Power Grid Corporation
1,04,161
199
223
12.0
top-line CAGR of ~16% and bottom-line CAGR of ~19%
over FY16-18 on back of strong capitalization guidance
Source: Company, Angel Research
Mid Cap
M
arket Cap
CM
P
T
arget
Upsid
e
Company
Rationale
(` Cr)
(`)
(`)
(%)
We expect the company would report strong profitability
Asian Granito
849
282
351
24.4
owing to better product mix, higher B2C sales and
amalgamation synergy.
Among the top 4 players in the consumer durables segment.
Bajaj Electricals
2,652
262
295
12.6
Improved profitability backed by turn around in E&P segment.
Strong order book lends earnings visibility.
Favourable outlook for the AC industry to augur well for
Cooling products business which is out pacing the market
Blue Star
5,322
557
634
13.8
growth. EMPPAC division's profitability to improve once
operating environment turns around.
With a focus on the low and medium income (LMI) consumer
Dewan Housing Finance
10,368
331
350
5.7
segment, the company has increased its presence in tier-II &
III cities where the growth opportunity is immense.
Strong loan growth backed by diversified loan portfolio and
Equitas Holdings
6,071
180
235
30.6
adequate CAR. ROE & ROA likely to remain decent as risk of
dilution remains low. Attractive valuations considering growth.
Economic recovery to have favourable impact on advertising
& circulation revenue growth. Further, the acquisition of a
Jagran Prakashan
6,043
185
225
21.7
radio business (Radio City) would also boost the company's
revenue growth.
High order book execution in EPC segment, rising B2C sales
KEI Industries
1,339
172
207
20.3
and higher exports to boost the revenues and profitability
Speedier execution and speedier sales, strong revenue visibilty
Mahindra Lifespace
1,433
349
522
49.5
in short-to-long run, attractive valuations
Higher growth in domestic branded sales and healthy export
Mirza International
1,106
92
107
16.4
to boost the profitability.
Massive capacity expansion along with rail advantage at ICD
Navkar Corporation
2,300
161
265
64.3
as well CFS augurs well for the company
Market leadership in Hindi news genre and no. 2 viewership
ranking in English news genre, exit from the radio business,
TV Today Network
1,579
265
385
45.4
and anticipated growth in ad spends by corporates to benefit
the stock.
Source: Company, Angel Research
Market Outlook
February 27, 2017
Key Upcoming Events
Global economic events release calendar
Bloomberg Data
Date
Time
Country
Event Description
Unit
Period
Last Reported
Estimated
Feb 27, 2017
8:30 PM US
New home sales
Thousands
Jan
536.00
570.00
Feb 28, 2017
8:30 PM US
Consumer Confidence
S.A./ 1985=100 Feb
111.80
110.90
2:25 PM Germany Unemployment change (000's)
Thousands
Feb
-26.00
Mar 01, 2017
7:00 PM US
GDP Qoq (Annualised)
% Change 4Q S
1.90
2.10
2:25 PM Germany PMI Manufacturing
Value
Feb F
57.00
3:00 PM UK
PMI Manufacturing
Value
Feb
55.90
6:30 AM China
PMI Manufacturing
Value
Feb
51.30
51.10
Mar 03, 2017
2:25 PM Germany PMI Services
Value
Feb F
54.40
Mar 07, 2017
3:30 PM Euro Zone Euro-Zone GDP s.a. (QoQ)
% Change 4Q F
0.40
Mar 08, 2017
China
Exports YoY%
% Change
Feb
7.90
Mar 09, 2017
7:00 AM China
Consumer Price Index (YoY)
% Change
Feb
2.50
6:15 PM Euro Zone ECB announces interest rates
%
Mar 9
0.00
Mar 10, 2017
India
Imports YoY%
% Change
Feb
10.70
India
Exports YoY%
% Change
Feb
4.30
5:30 PM India
Industrial Production YoY
% Change
Jan
-0.40
3:00 PM UK
Industrial Production (YoY)
% Change
Jan
4.30
7:00 PM US
Change in Nonfarm payrolls
Thousands
Feb
227.00
175.00
7:00 PM US
Unnemployment rate
%
Feb
4.80
4.70
Mar 14, 2017 12:00 PM India
Monthly Wholesale Prices YoY%
% Change
Feb
5.25
Source: Bloomberg, Angel Research
Market Outlook
February 27, 2017
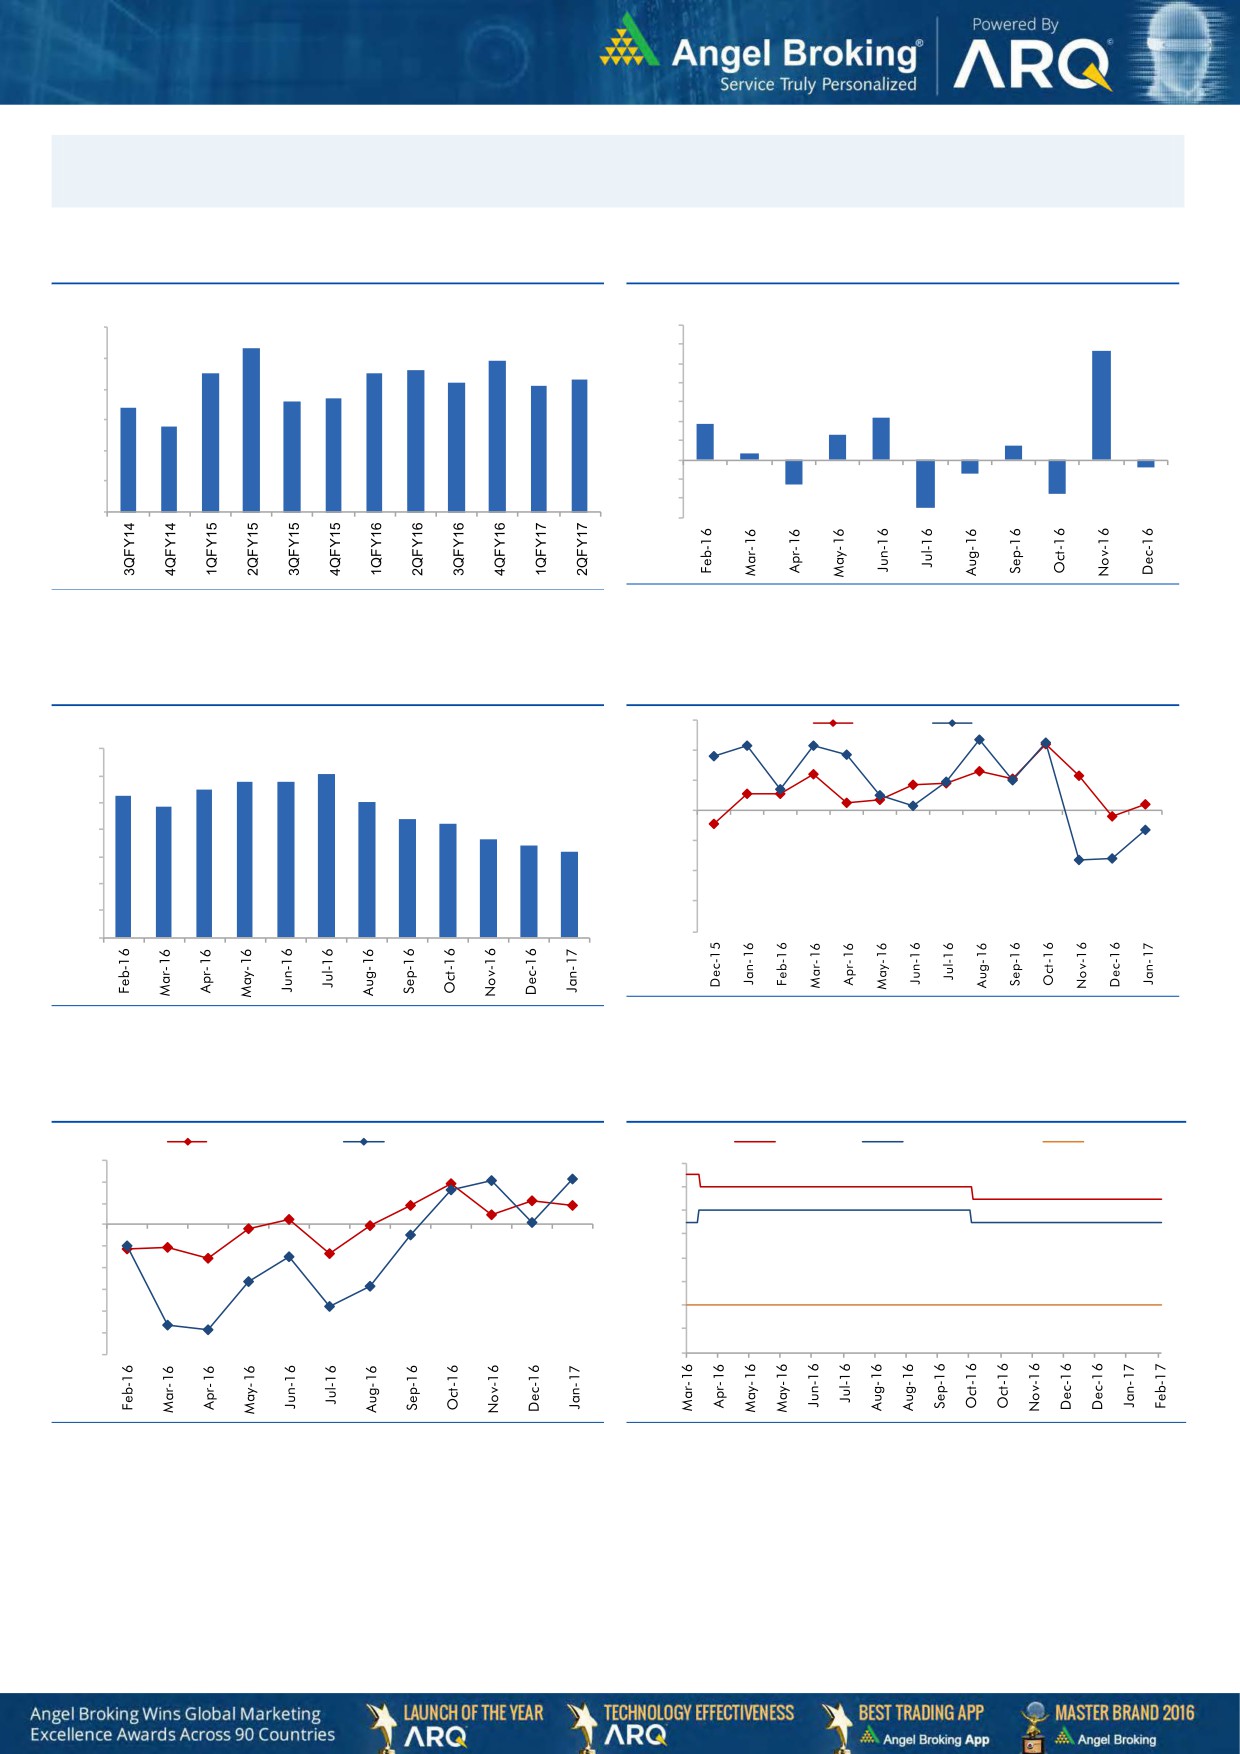
Macro watch
Exhibit 1: Quarterly GDP trends
Exhibit 2: IIP trends
(%)
(%)
9.0
7.0
8.3
5.7
7.9
6.0
8.0
7.5
7.5
7.6
7.3
5.0
7.2
7.1
6.6
6.7
4.0
7.0
6.4
3.0
2.2
5.8
1.9
6.0
2.0
1.3
0.7
1.0
0.3
5.0
-
4.0
(1.0)
(0.7)
(0.4)
(2.0)
(1.3)
3.0
(1.8)
(3.0)
(2.5)
Source: MOSPI, Angel Research
Source: CSO, Angel Research
Exhibit 3: Monthly CPI inflation trends
Exhibit 4: Manufacturing and services PMI
56.0
Mfg. PMI
Services PMI
(%)
7.0
54.0
6.1
5.8
5.8
6.0
5.5
5.3
5.1
52.0
4.8
5.0
4.4
4.2
50.0
3.6
4.0
3.4
3.2
48.0
3.0
46.0
2.0
44.0
1.0
42.0
-
Source: Market, Angel Research; Note: Level above 50 indicates expansion
Source: MOSPI, Angel Research
Exhibit 5: Exports and imports growth trends
Exhibit 6: Key policy rates
(%)
Exports yoy growth
Imports yoy growth
(%)
Repo rate
Reverse Repo rate
CRR
15.0
7.00
10.0
6.50
5.0
6.00
0.0
5.50
(5.0)
5.00
(10.0)
4.50
(15.0)
4.00
(20.0)
(25.0)
3.50
(30.0)
3.00
Source: Bloomberg, Angel Research
Source: RBI, Angel Research
Market Outlook
February 27, 2017
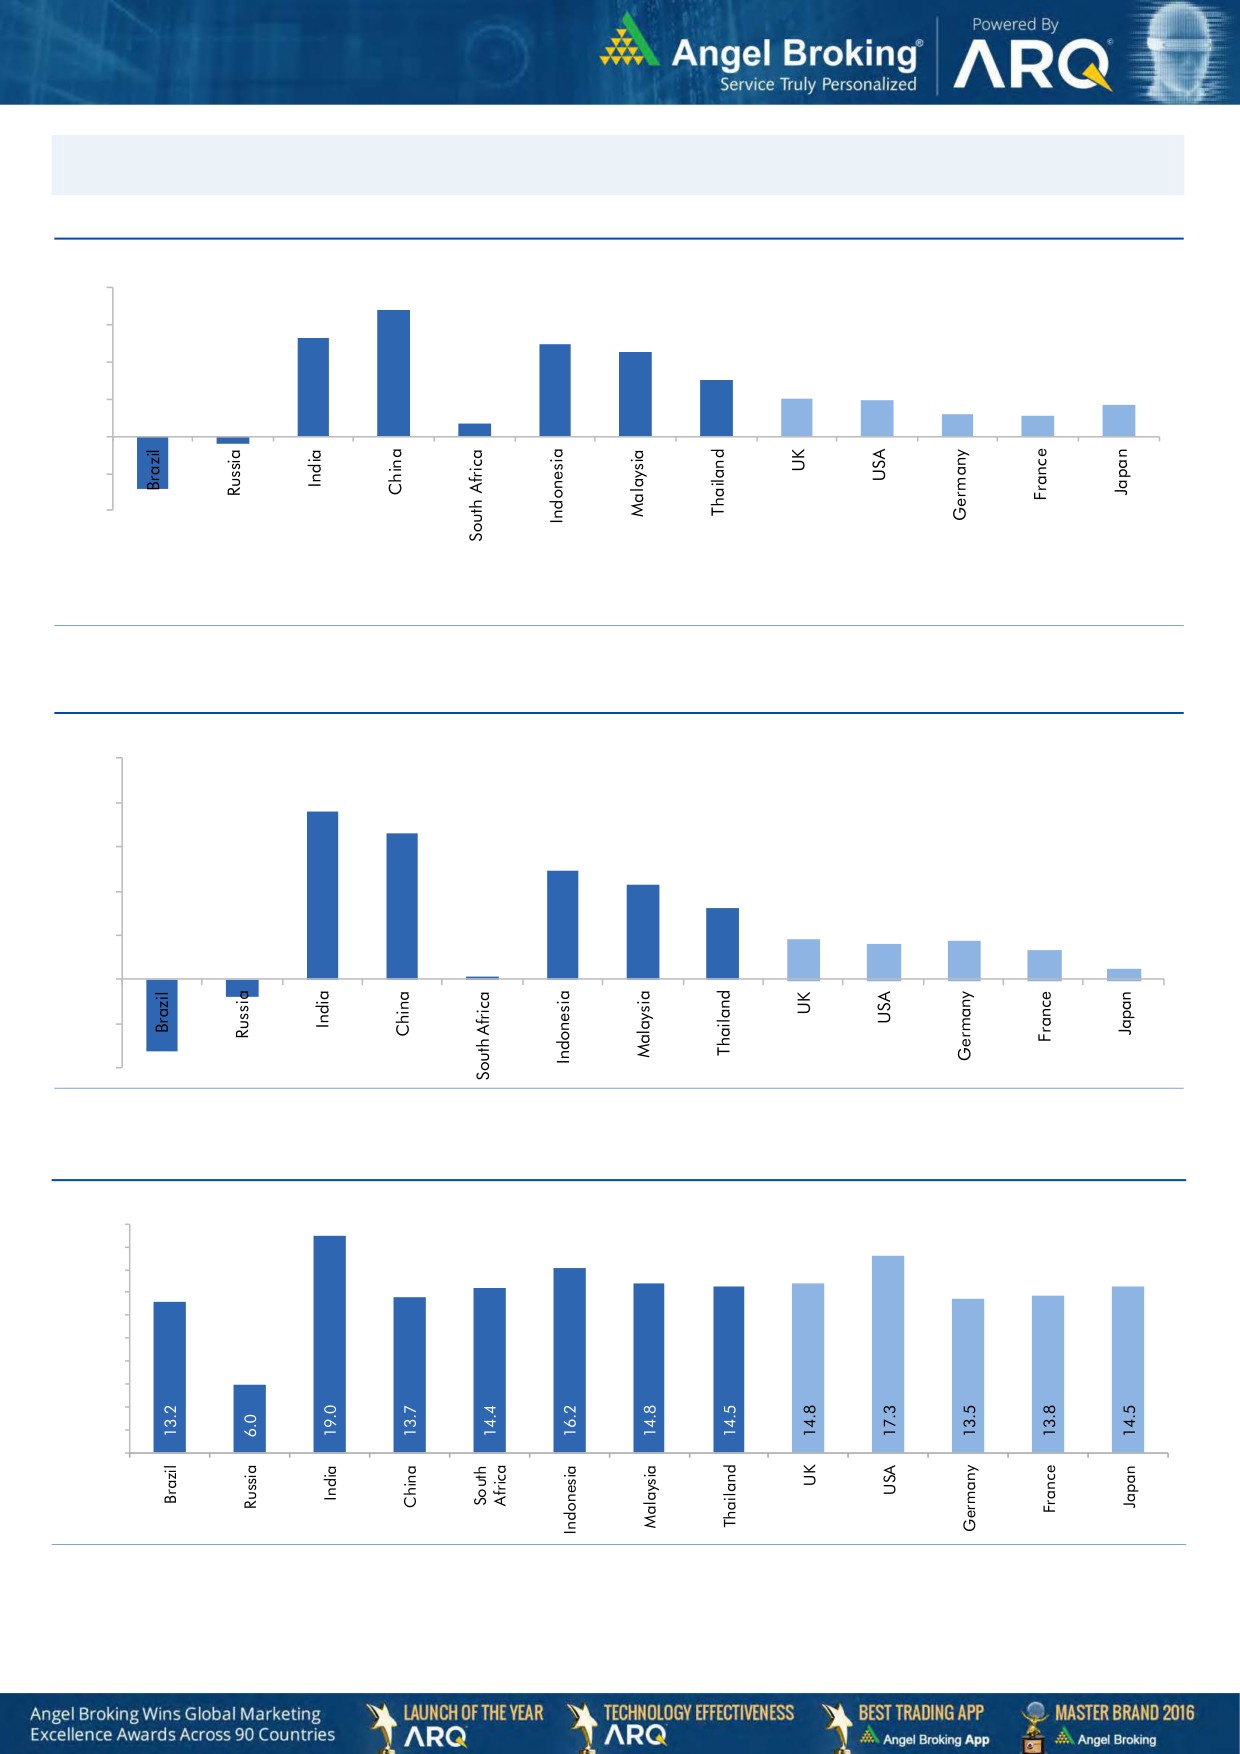
Global watch
Exhibit 1: Latest quarterly GDP Growth (%, yoy) across select developing and developed countries
(%)
8.0
6.8
0.7
5.3
6.0
4.9
4.5
4.0
3.0
2.0
1.9
1.2
1.7
1.1
2.0
-
(2.0)
(0.4)
(4.0)
(2.9)
Source: Bloomberg, Angel Research
Exhibit 2: 2016 GDP Growth projection by IMF (%, yoy) across select developing and developed countries
(%)
10.0
7.6
8.0
6.6
6.0
4.9
4.3
4.0
3.2
1.8
1.7
1.6
2.0
1.3
(0.8)
0.5
(3.3)
0.1
-
(2.0)
(4.0)
Source: IMF, Angel Research
Exhibit 3: One year forward P-E ratio across select developing and developed countries
(x)
20.0
18.0
16.0
14.0
12.0
10.0
8.0
6.0
4.0
2.0
-
Source: IMF, Angel Research
Market Outlook
February 27, 2017
Exhibit 4: Relative performance of indices across globe
Returns (%)
Country
Name of index
Closing price
1M
3M
1YR
Brazil
Bovespa
66,662
1.2
8.6
60.3
Russia
Micex
2,093
(3.7)
(0.5)
13.7
India
Nifty
8,940
6.5
12.2
24.3
China
Shanghai Composite
3,253
4.7
0.9
13.3
South Africa
Top 40
44,581
(3.9)
0.0
3.8
Mexico
Mexbol
47,048
(2.3)
3.9
7.6
Indonesia
LQ45
896
1.3
2.9
6.8
Malaysia
KLCI
1,698
2.0
4.6
1.4
Thailand
SET 50
982
(0.3)
6.8
22.0
USA
Dow Jones
20,822
4.6
9.8
25.1
UK
FTSE
7,244
1.1
6.2
18.8
Japan
Nikkei
19,284
1.2
6.5
21.8
Germany
DAX
11,804
(0.0)
10.3
21.0
France
CAC
4,845
(0.7)
6.5
9.1
Source: Bloomberg, Angel Research
Stock Watch
February 27, 2017
Company Name
Reco
CMP
Target
Mkt Cap
Sales ( Čcr )
OPM(%)
EPS (Č)
PER(x)
P/BV(x)
RoE(%)
EV/Sales(x)
(Č)
Price ( Č)
( Č cr )
FY17E FY18E
FY17E
FY18E
FY17E
FY18E
FY17E
FY18E
FY17E
FY18E
FY17E
FY18E
FY17E
FY18E
Agri / Agri Chemical
Rallis
Neutral
237
-
4,599
1,937
2,164
13.3
14.3
9.0
11.0
26.3
21.5
4.6
4.0
18.4
19.8
2.4
2.1
United Phosphorus
Neutral
718
-
36,419
15,176
17,604
18.5
18.5
37.4
44.6
19.2
16.1
3.8
3.1
21.4
21.2
2.5
2.1
Auto & Auto Ancillary
Ashok Leyland
Buy
91
111
25,784
20,021
21,915
11.6
11.9
4.5
5.3
20.1
17.0
4.1
3.7
20.6
21.5
1.2
1.1
Bajaj Auto
Neutral
2,812
-
81,371
25,093
27,891
19.5
19.2
143.9
162.5
19.5
17.3
5.5
4.7
30.3
29.4
3.0
2.6
Bharat Forge
Neutral
1,070
-
24,918
7,726
8,713
20.5
21.2
35.3
42.7
30.3
25.1
5.6
5.1
18.9
20.1
3.3
2.9
Eicher Motors
Neutral
24,878
-
67,693
16,583
20,447
17.5
18.0
598.0
745.2
41.6
33.4
14.2
10.8
41.2
38.3
3.9
3.1
Gabriel India
Accumulate
114
130
1,640
1,544
1,715
9.0
9.3
5.4
6.3
21.2
18.1
4.0
3.5
18.9
19.5
1.0
0.9
Hero Motocorp
Accumulate
3,177
3,446
63,448
28,083
30,096
15.3
15.7
171.8
187.0
18.5
17.0
6.5
5.4
30.1
27.9
2.1
1.9
Jamna Auto Industries Neutral
217
-
1,731
1,486
1,620
9.8
9.9
15.0
17.2
14.5
12.6
3.2
2.7
21.8
21.3
1.2
1.1
L G Balakrishnan & Bros Neutral
566
-
888
1,302
1,432
11.6
11.9
43.7
53.0
13.0
10.7
1.8
1.7
13.8
14.2
0.8
0.7
Mahindra and Mahindra Neutral
1,309
-
81,273
46,534
53,077
11.6
11.7
67.3
78.1
19.4
16.8
3.2
2.8
15.4
15.8
1.7
1.5
Maruti
Accumulate
6,035
6,560
182,296
67,822
83,288
16.0
16.4
253.8
312.4
23.8
19.3
5.5
4.4
23.0
22.9
2.4
1.8
Minda Industries
Neutral
394
-
3,129
2,728
3,042
9.0
9.1
68.2
86.2
5.8
4.6
1.3
1.0
23.8
24.3
1.2
1.0
Motherson Sumi
Neutral
349
-
49,028
45,896
53,687
7.8
8.3
13.0
16.1
26.8
21.7
8.6
6.9
34.7
35.4
1.1
1.0
Rane Brake Lining
Neutral
960
-
759
511
562
11.3
11.5
28.1
30.9
34.2
31.0
5.2
4.7
15.3
15.0
1.6
1.5
Setco Automotive
Neutral
35
-
466
741
837
13.0
13.0
15.2
17.0
2.3
2.1
0.4
0.3
15.8
16.3
1.0
0.9
Tata Motors
Neutral
462
-
133,395
300,209
338,549
8.9
8.4
42.7
54.3
10.8
8.5
1.7
1.5
15.6
17.2
0.6
0.5
TVS Motor
Neutral
433
-
20,588
13,390
15,948
6.9
7.1
12.8
16.5
34.0
26.2
8.5
6.7
26.3
27.2
1.6
1.3
Amara Raja Batteries
Buy
846
1,009
14,458
5,305
6,100
16.0
16.3
28.4
34.0
29.8
24.9
5.8
4.8
19.3
19.3
2.7
2.4
Exide Industries
Neutral
212
-
18,054
7,439
8,307
15.0
15.0
8.1
9.3
26.2
22.8
3.7
3.3
14.3
16.7
2.0
1.8
Apollo Tyres
Buy
184
235
9,379
12,877
14,504
14.3
13.9
21.4
23.0
8.6
8.0
1.3
1.2
16.4
15.2
0.9
0.8
Ceat
Buy
1,157
1,450
4,681
7,524
8,624
13.0
12.7
131.1
144.3
8.8
8.0
1.6
1.4
19.8
18.6
0.7
0.6
JK Tyres
Neutral
121
-
2,740
7,455
8,056
15.0
15.0
21.8
24.5
5.5
4.9
1.2
0.9
22.8
21.3
0.5
0.4
Swaraj Engines
Neutral
1,379
-
1,713
660
810
15.2
16.4
54.5
72.8
25.3
19.0
7.9
7.2
31.5
39.2
2.4
1.9
Subros
Neutral
200
-
1,201
1,488
1,681
11.7
11.9
6.4
7.2
31.3
27.9
3.3
3.0
10.8
11.4
1.0
0.9
Indag Rubber
Neutral
175
-
458
286
326
19.8
16.8
11.7
13.3
14.9
13.1
2.5
2.4
17.8
17.1
1.3
1.1
Capital Goods
ACE
Neutral
53
-
526
709
814
4.1
4.6
1.4
2.1
38.0
25.3
1.6
1.5
4.4
6.0
0.9
0.8
BEML
Neutral
1,320
-
5,496
3,451
4,055
6.3
9.2
31.4
57.9
42.0
22.8
2.5
2.3
6.3
10.9
1.7
1.4
Bharat Electronics
Neutral
1,505
-
33,626
8,137
9,169
16.8
17.2
58.7
62.5
25.7
24.1
4.0
3.5
44.6
46.3
3.1
2.8
Stock Watch
February 27, 2017
Company Name
Reco
CMP
Target
Mkt Cap
Sales ( Čcr )
OPM(%)
EPS (Č)
PER(x)
P/BV(x)
RoE(%)
EV/Sales(x)
(Č)
Price ( Č)
( Č cr )
FY17E
FY18E
FY17E
FY18E
FY17E
FY18E
FY17E
FY18E
FY17E
FY18E
FY17E
FY18E
FY17E
FY18E
Capital Goods
Voltas
Accumulate
357
407
11,806
6,511
7,514
7.9
8.7
12.9
16.3
27.7
21.9
5.0
4.4
16.7
18.5
1.6
1.3
BGR Energy
Neutral
138
-
996
16,567
33,848
6.0
5.6
7.8
5.9
17.7
23.4
1.0
1.0
4.7
4.2
0.2
0.1
BHEL
Neutral
154
-
37,571
28,797
34,742
-
2.8
2.3
6.9
66.7
22.3
1.1
1.1
1.3
4.8
1.0
0.7
Blue Star
Accumulate
557
634
5,322
4,283
5,077
5.9
7.3
14.9
22.1
37.4
25.2
7.3
6.1
20.4
26.4
1.3
1.1
Crompton Greaves
Neutral
68
-
4,234
5,777
6,120
5.9
7.0
3.3
4.5
20.5
15.0
0.9
0.9
4.4
5.9
0.7
0.6
Greaves Cotton
Neutral
158
-
3,856
1,755
1,881
16.8
16.9
7.8
8.5
20.2
18.6
4.1
3.8
20.6
20.9
1.9
1.7
Inox Wind
Neutral
179
-
3,962
5,605
6,267
15.7
16.4
24.8
30.0
7.2
6.0
2.0
1.5
25.9
24.4
0.7
0.6
KEC International
Neutral
166
-
4,256
9,294
10,186
7.9
8.1
9.9
11.9
16.7
13.9
2.5
2.1
15.6
16.3
0.7
0.6
KEI Industries
Buy
172
207
1,339
2,682
3,058
10.4
10.0
11.7
12.8
14.7
13.4
2.9
2.4
20.1
18.2
0.7
0.6
Thermax
Neutral
851
-
10,142
5,421
5,940
7.3
7.3
25.7
30.2
33.1
28.2
4.0
3.7
12.2
13.1
1.8
1.6
VATech Wabag
Buy
557
681
3,040
3,136
3,845
8.9
9.1
26.0
35.9
21.4
15.5
2.7
2.3
13.4
15.9
0.9
0.7
Cement
ACC
Neutral
1,437
-
26,993
11,225
13,172
13.2
16.9
44.5
75.5
32.3
19.0
3.1
2.8
11.2
14.2
2.4
2.1
Ambuja Cements
Neutral
232
-
46,047
9,350
10,979
18.2
22.5
5.8
9.5
40.0
24.4
3.4
3.0
10.2
12.5
4.9
4.2
India Cements
Neutral
166
-
5,108
4,364
4,997
18.5
19.2
7.9
11.3
21.1
14.7
1.5
1.5
8.0
8.5
1.9
1.7
JK Cement
Neutral
878
-
6,137
4,398
5,173
15.5
17.5
31.2
55.5
28.1
15.8
3.4
2.9
12.0
15.5
1.9
1.6
J K Lakshmi Cement
Neutral
395
-
4,643
2,913
3,412
14.5
19.5
7.5
22.5
52.6
17.5
3.2
2.7
12.5
18.0
2.2
1.8
Orient Cement
Neutral
147
-
3,021
2,114
2,558
18.5
20.5
8.1
11.3
18.2
13.1
2.7
2.3
9.0
14.0
2.0
1.6
UltraTech Cement
Neutral
3,790
-
104,017
25,768
30,385
21.0
23.5
111.0
160.0
34.1
23.7
4.4
3.8
13.5
15.8
4.1
3.4
Construction
ITNL
Neutral
99
-
3,247
8,946
10,017
31.0
31.6
8.1
9.1
12.2
10.9
0.5
0.5
4.2
5.0
3.7
3.4
KNR Constructions
Neutral
175
-
2,462
1,385
1,673
14.7
14.0
41.2
48.5
4.3
3.6
0.8
0.7
14.9
15.2
1.9
1.5
Larsen & Toubro
Accumulate
1,486
1,634
138,643
111,017
124,908
11.0
11.0
61.1
66.7
24.3
22.3
2.9
2.7
13.1
12.9
2.3
2.1
Gujarat Pipavav Port
Neutral
157
-
7,600
705
788
52.2
51.7
5.0
5.6
31.4
28.1
3.1
2.8
11.2
11.2
10.4
8.8
Nagarjuna Const.
Neutral
82
-
4,548
8,842
9,775
9.1
8.8
5.3
6.4
15.4
12.8
1.2
1.1
8.2
9.1
0.7
0.6
PNC Infratech
Buy
102
143
2,615
2,350
2,904
13.1
13.2
9.0
8.8
11.3
11.6
0.4
0.4
15.9
13.9
1.2
1.0
Simplex Infra
Neutral
303
-
1,500
6,829
7,954
10.5
10.5
31.4
37.4
9.7
8.1
1.0
0.9
9.9
13.4
0.6
0.5
Power Mech Projects
Neutral
441
-
648
1,801
2,219
12.7
14.6
72.1
113.9
6.1
3.9
1.1
1.0
16.8
11.9
0.4
0.3
Sadbhav Engineering
Accumulate
276
298
4,735
3,598
4,140
10.3
10.6
9.0
11.9
30.7
23.2
3.2
2.8
9.9
11.9
1.6
1.4
NBCC
Neutral
172
-
15,449
7,428
9,549
7.9
8.6
8.2
11.0
20.9
15.6
1.0
0.8
28.2
28.7
1.8
1.3
MEP Infra
Neutral
41
-
670
1,877
1,943
30.6
29.8
3.0
4.2
13.7
9.8
6.7
4.5
0.6
0.6
1.7
1.6
Stock Watch
February 27, 2017
Company Name
Reco
CMP
Target
Mkt Cap
Sales ( Čcr )
OPM(%)
EPS (Č)
PER(x)
P/BV(x)
RoE(%)
EV/Sales(x)
(Č)
Price ( Č)
( Č cr )
FY17E
FY18E
FY17E
FY18E
FY17E
FY18E
FY17E
FY18E
FY17E
FY18E
FY17E
FY18E
FY17E
FY18E
Construction
SIPL
Neutral
93
-
3,262
1,036
1,252
65.5
66.2
(8.4)
(5.6)
3.5
4.0
(22.8)
(15.9)
11.4
9.5
Engineers India
Neutral
148
-
9,943
1,725
1,935
16.0
19.1
11.4
13.9
12.9
10.6
1.8
1.7
13.4
15.3
4.7
4.2
Financials
Axis Bank
Accumulate
528
580
126,223
46,932
53,575
3.5
3.4
32.4
44.6
16.3
11.8
2.1
1.8
13.6
16.5
-
-
Bank of Baroda
Neutral
168
-
38,744
19,980
23,178
1.8
1.8
11.5
17.3
14.6
9.7
1.7
1.4
8.3
10.1
-
-
Canara Bank
Neutral
291
-
15,817
15,225
16,836
1.8
1.8
14.5
28.0
20.1
10.4
1.4
1.1
5.8
8.5
-
-
Can Fin Homes
Accumulate
1,995
2,128
5,312
420
526
3.5
3.5
86.5
107.8
23.1
18.5
5.0
4.1
23.6
24.1
-
-
Cholamandalam Inv. &
Buy
1,017
1,230
15,898
2,012
2,317
6.3
6.3
42.7
53.6
23.8
19.0
3.8
3.2
16.9
18.3
-
-
Fin. Co.
Dewan Housing Finance Accumulate
331
350
10,368
2,225
2,688
2.9
2.9
29.7
34.6
11.2
9.6
1.8
1.5
16.1
16.8
-
-
Equitas Holdings
Buy
180
235
6,071
939
1,281
11.7
11.5
5.8
8.2
31.0
21.9
2.7
2.4
10.9
11.5
-
-
Federal Bank
Neutral
84
-
14,469
8,259
8,995
3.0
3.0
4.3
5.6
19.6
15.0
1.7
1.5
8.5
10.1
-
-
HDFC
Neutral
1,385
-
219,667
11,475
13,450
3.4
3.4
45.3
52.5
30.6
26.4
5.9
5.2
20.2
20.5
-
-
HDFC Bank
Neutral
1,395
-
356,804
46,097
55,433
4.5
4.5
58.4
68.0
23.9
20.5
4.2
3.5
18.8
18.6
-
-
ICICI Bank
Accumulate
284
315
165,602
42,800
44,686
3.1
3.3
18.0
21.9
15.8
13.0
2.1
2.0
11.1
12.3
-
-
Lakshmi Vilas Bank
Accumulate
157
174
2,997
3,339
3,799
2.7
2.8
11.0
14.0
14.2
11.2
1.5
1.4
11.2
12.7
-
-
LIC Housing Finance
Accumulate
566
630
28,546
3,712
4,293
2.6
2.5
39.0
46.0
14.5
12.3
2.7
2.3
19.9
20.1
-
-
Punjab Natl.Bank
Neutral
140
-
29,877
23,532
23,595
2.3
2.4
6.8
12.6
20.7
11.1
3.2
2.3
3.3
6.5
-
-
RBL Bank
Neutral
457
-
16,897
1,783
2,309
2.6
2.6
12.7
16.4
36.0
27.9
3.9
3.5
12.8
13.3
-
-
South Ind.Bank
Neutral
21
-
2,779
6,435
7,578
2.5
2.5
2.7
3.1
7.6
6.6
1.0
0.8
10.1
11.2
-
-
St Bk of India
Neutral
271
-
215,683
88,650
98,335
2.6
2.6
13.5
18.8
20.0
14.4
1.9
1.7
7.0
8.5
-
-
Union Bank
Neutral
144
-
9,916
13,450
14,925
2.3
2.3
25.5
34.5
5.7
4.2
0.8
0.7
7.5
10.2
-
-
Yes Bank
Neutral
1,445
-
61,158
8,978
11,281
3.3
3.4
74.0
90.0
19.5
16.1
3.7
3.1
17.0
17.2
-
-
FMCG
Asian Paints
Neutral
1,009
-
96,764
17,128
18,978
16.8
16.4
19.1
20.7
52.8
48.7
18.4
17.3
34.8
35.5
5.6
5.0
Britannia
Accumulate
3,228
3,626
38,741
9,594
11,011
14.6
14.9
80.3
94.0
40.2
34.3
16.5
12.8
41.2
-
3.9
3.4
Colgate
Accumulate
894
995
24,309
4,605
5,149
23.4
23.4
23.8
26.9
37.6
33.2
20.8
16.3
64.8
66.8
5.2
4.6
Dabur India
Accumulate
270
304
47,508
8,315
9,405
19.8
20.7
8.1
9.2
33.3
29.3
9.3
7.7
31.6
31.0
5.4
4.7
GlaxoSmith Con*
Neutral
5,205
-
21,889
4,350
4,823
21.2
21.4
179.2
196.5
29.0
26.5
7.7
6.5
27.1
26.8
4.4
3.9
Godrej Consumer
Neutral
1,668
-
56,819
10,235
11,428
18.4
18.6
41.1
44.2
40.6
37.7
9.0
7.6
24.9
24.8
5.6
5.0
HUL
Neutral
858
-
185,771
35,252
38,495
17.8
17.8
20.7
22.4
41.6
38.3
39.7
34.1
95.6
88.9
5.1
4.7
ITC
Accumulate
266
284
322,305
40,059
44,439
38.3
39.2
9.0
10.1
29.6
26.2
8.3
7.2
27.8
27.5
7.5
6.8
Stock Watch
February 27, 2017
Company Name
Reco
CMP
Target
Mkt Cap
Sales ( Čcr )
OPM(%)
EPS (Č)
PER(x)
P/BV(x)
RoE(%)
EV/Sales(x)
(Č)
Price ( Č)
( Č cr )
FY17E FY18E
FY17E
FY18E
FY17E
FY18E
FY17E
FY18E
FY17E
FY18E
FY17E
FY18E
FY17E
FY18E
FMCG
Marico
Accumulate
269
300
34,730
6,430
7,349
18.8
19.5
6.4
7.7
42.1
35.0
12.7
10.7
33.2
32.5
5.2
4.5
Nestle*
Neutral
6,367
-
61,385
10,073
11,807
20.7
21.5
124.8
154.2
51.0
41.3
20.9
18.8
34.8
36.7
5.9
5.0
Tata Global
Neutral
139
-
8,788
8,675
9,088
9.8
9.8
7.4
8.2
18.8
17.0
2.1
2.0
7.9
8.1
0.9
0.9
Procter & Gamble
Neutral
7,055
-
22,901
2,939
3,342
23.2
23.0
146.2
163.7
48.3
43.1
108.0
103.6
25.3
23.5
7.3
6.4
Hygiene
IT
HCL Tech^
Buy
843
1,000
118,908
49,242
57,168
20.5
20.5
55.7
64.1
15.1
13.2
3.1
2.4
20.3
17.9
2.3
1.8
Infosys
Buy
1,009
1,249
231,773
68,350
77,326
27.0
27.0
62.5
69.4
16.1
14.5
3.4
3.1
21.3
21.6
2.8
2.5
TCS
Accumulate
2,482
2,700
488,991
119,025
133,308
27.6
27.6
131.2
145.5
18.9
17.1
6.1
5.6
32.4
33.1
3.9
3.4
Tech Mahindra
Buy
503
600
48,971
29,673
32,937
15.5
17.0
32.8
39.9
15.3
12.6
3.0
2.6
19.6
20.7
1.4
1.2
Wipro
Buy
486
583
118,031
55,440
60,430
18.1
18.1
36.1
38.9
13.5
12.5
2.4
2.2
19.0
17.6
1.8
1.6
Media
D B Corp
Neutral
380
-
6,993
2,297
2,590
27.4
28.2
21.0
23.4
18.1
16.3
4.2
3.7
23.7
23.1
2.8
2.5
HT Media
Neutral
83
-
1,935
2,693
2,991
12.6
12.9
7.9
9.0
10.5
9.2
0.9
0.8
7.8
8.3
0.3
0.2
Jagran Prakashan
Buy
185
225
6,043
2,355
2,635
28.0
28.0
10.8
12.5
17.1
14.8
3.7
3.2
21.7
21.7
2.6
2.3
Sun TV Network
Neutral
705
-
27,769
2,850
3,265
70.1
71.0
26.2
30.4
26.9
23.2
6.9
6.1
24.3
25.6
9.3
8.0
Hindustan Media
Neutral
271
-
1,987
1,016
1,138
24.3
25.2
27.3
30.1
9.9
9.0
1.9
1.7
16.2
15.8
1.3
1.1
Ventures
TV Today Network
Buy
265
385
1,579
637
743
27.5
27.5
18.4
21.4
14.4
12.4
2.5
2.1
17.4
17.2
2.1
1.7
Metals & Mining
Coal India
Neutral
329
-
203,913
84,638
94,297
21.4
22.3
24.5
27.1
13.4
12.1
5.6
5.3
42.6
46.0
1.9
1.7
Hind. Zinc
Neutral
302
-
127,689
14,252
18,465
55.9
48.3
15.8
21.5
19.1
14.1
3.1
2.7
17.0
20.7
9.0
6.9
Hindalco
Neutral
182
-
37,629
107,899
112,095
7.4
8.2
9.2
13.0
19.8
14.0
1.0
0.9
4.8
6.6
0.9
0.8
JSW Steel
Neutral
186
-
45,069
53,201
58,779
16.1
16.2
130.6
153.7
1.4
1.2
0.2
0.2
14.0
14.4
1.6
1.4
NMDC
Neutral
142
-
44,911
6,643
7,284
44.4
47.7
7.1
7.7
20.0
18.4
1.7
1.7
8.8
9.2
4.5
4.1
SAIL
Neutral
60
-
24,822
47,528
53,738
(0.7)
2.1
(1.9)
2.6
23.1
0.7
0.6
(1.6)
3.9
1.4
1.2
Vedanta
Neutral
263
-
77,927
71,744
81,944
19.2
21.7
13.4
20.1
19.6
13.1
1.7
1.5
8.4
11.3
1.5
1.2
Tata Steel
Neutral
485
-
47,114
121,374
121,856
7.2
8.4
18.6
34.3
26.1
14.1
1.6
1.5
6.1
10.1
1.0
1.0
Oil & Gas
Cairn India
Neutral
286
-
53,716
9,127
10,632
4.3
20.6
8.8
11.7
32.5
24.5
1.1
1.0
3.3
4.2
7.3
6.1
GAIL
Neutral
517
-
65,593
56,220
65,198
9.3
10.1
27.1
33.3
19.1
15.5
1.7
1.6
9.3
10.7
1.4
1.1
ONGC
Neutral
196
-
251,082
137,222
152,563
15.0
21.8
19.5
24.1
10.0
8.1
0.9
0.8
8.5
10.1
2.1
1.9
Indian Oil Corp
Neutral
385
-
187,001
373,359
428,656
5.9
5.5
54.0
59.3
7.1
6.5
1.1
1.0
16.0
15.6
0.7
0.6
Reliance Industries
Neutral
1,183
-
383,619
301,963
358,039
12.1
12.6
87.7
101.7
13.5
11.6
1.4
1.3
10.7
11.3
1.7
1.5
Pharmaceuticals
Alembic Pharma
Neutral
572
-
10,774
3,483
4,083
20.2
21.4
24.3
30.4
23.5
18.8
5.4
4.3
25.5
25.3
3.0
2.5
Stock Watch
February 27, 2017
Company Name
Reco
CMP
Target
Mkt Cap
Sales ( Čcr )
OPM(%)
EPS (Č)
PER(x)
P/BV(x)
RoE(%)
EV/Sales(x)
(Č)
Price ( Č)
( Č cr )
FY17E
FY18E
FY17E
FY18E
FY17E
FY18E
FY17E
FY18E
FY17E
FY18E
FY17E
FY18E
FY17E
FY18E
Pharmaceuticals
Alkem Laboratories Ltd
Accumulate
2,077
2,203
24,832
6,065
7,009
18.7
20.0
80.2
92.0
25.9
22.6
5.8
4.9
22.5
21.6
4.0
3.5
Aurobindo Pharma
Buy
667
877
39,040
15,720
18,078
23.7
23.7
41.4
47.3
16.1
14.1
4.2
3.3
29.6
26.1
2.7
2.3
Aventis*
Neutral
4,139
-
9,532
2,277
2,597
17.3
18.3
149.4
172.0
27.7
24.1
4.6
3.7
25.1
28.8
3.9
3.1
Cadila Healthcare
Neutral
430
-
44,026
10,429
12,318
17.7
21.6
13.1
19.2
32.8
22.4
6.9
5.5
22.8
27.1
4.3
3.5
Cipla
Sell
592
465
47,593
15,378
18,089
15.7
16.8
19.3
24.5
30.7
24.2
3.6
3.2
12.3
13.9
3.3
2.7
Dr Reddy's
Neutral
2,890
-
47,880
16,043
18,119
18.0
23.0
78.6
130.9
36.8
22.1
3.6
3.2
10.1
15.2
2.8
2.6
Dishman Pharma
Neutral
225
-
3,627
1,718
1,890
22.7
22.8
9.5
11.3
23.7
19.9
2.3
2.1
10.1
10.9
2.6
2.2
GSK Pharma*
Neutral
2,666
-
22,585
2,800
3,290
10.2
20.6
32.2
60.3
82.8
44.2
15.3
15.2
17.2
34.5
7.8
6.7
Indoco Remedies
Reduce
271
240
2,500
1,112
1,289
16.2
18.2
11.6
16.0
23.4
17.0
3.7
3.1
17.0
20.1
2.4
2.0
Ipca labs
Accumulate
541
613
6,825
3,258
3,747
12.8
15.3
12.1
19.2
44.7
28.2
2.8
2.6
6.4
9.5
2.2
1.9
Lupin
Buy
1,453
1,809
65,618
15,912
18,644
26.4
26.7
58.1
69.3
25.0
21.0
4.9
4.0
21.4
20.9
4.2
3.5
Sun Pharma
Buy
675
847
162,043
31,129
35,258
32.0
32.9
30.2
35.3
22.4
19.1
3.6
3.0
20.0
20.1
4.8
4.0
Power
Tata Power
Neutral
83
-
22,571
36,916
39,557
17.4
27.1
5.1
6.3
16.4
13.3
1.4
1.3
9.0
10.3
1.6
1.5
NTPC
Neutral
165
-
136,298
86,605
95,545
17.5
20.8
11.8
13.4
14.0
12.3
1.4
1.3
10.5
11.1
2.9
2.9
Power Grid
Accumulate
199
223
104,161
25,315
29,193
88.2
88.7
14.2
17.2
14.1
11.6
2.1
1.9
15.2
16.1
8.8
7.9
Real Estate
Prestige Estate
Buy
172
210
6,452
4,707
5,105
25.2
26.0
10.3
13.0
16.7
13.2
1.3
1.2
10.3
10.2
2.5
2.2
MLIFE
Buy
349
522
1,433
1,152
1,300
22.7
24.6
29.9
35.8
11.7
9.8
0.9
0.8
7.6
8.6
2.0
1.6
Telecom
Bharti Airtel
Neutral
366
-
146,325
105,086
114,808
34.5
34.7
12.2
16.4
30.0
22.3
2.0
1.9
6.8
8.4
2.3
2.0
Idea Cellular
Neutral
120
-
43,094
40,133
43,731
37.2
37.1
6.4
6.5
18.7
18.4
1.6
1.4
8.2
7.6
2.1
1.8
zOthers
Abbott India
Neutral
4,520
-
9,605
3,153
3,583
14.1
14.4
152.2
182.7
29.7
24.7
145.8
124.5
25.6
26.1
2.8
2.4
Asian Granito
Buy
282
351
849
1,060
1,169
12.2
12.5
12.7
15.9
22.3
17.8
2.1
1.9
9.5
10.7
1.1
1.0
Bajaj Electricals
Accumulate
262
295
2,652
4,801
5,351
5.7
6.2
10.4
13.7
25.1
19.2
3.1
2.8
12.4
14.5
0.5
0.5
Banco Products (India)
Neutral
205
-
1,463
1,353
1,471
12.3
12.4
14.5
16.3
14.1
12.6
19.5
17.6
14.5
14.6
1.0
109.6
Coffee Day Enterprises
Neutral
232
-
4,770
2,964
3,260
20.5
21.2
4.7
8.0
-
28.9
2.7
2.5
5.5
8.5
2.0
1.8
Ltd
Competent Automobiles Neutral
172
-
106
1,137
1,256
3.1
2.7
28.0
23.6
6.2
7.3
33.1
29.9
14.3
11.5
0.1
0.1
Elecon Engineering
Neutral
54
-
600
1,482
1,660
13.7
14.5
3.9
5.8
13.7
9.2
3.2
3.0
7.8
10.9
0.7
0.6
Finolex Cables
Neutral
443
-
6,772
2,883
3,115
12.0
12.1
14.2
18.6
31.2
23.8
16.6
14.5
15.8
14.6
2.0
1.8
Garware Wall Ropes
Accumulate
666
710
1,456
863
928
15.1
15.2
36.4
39.4
18.3
16.9
3.3
2.8
17.5
15.9
1.6
1.5
Goodyear India*
Neutral
716
-
1,651
1,598
1,704
10.4
10.2
49.4
52.6
14.5
13.6
66.9
58.7
18.2
17.0
0.7
99.8
Stock Watch
February 27, 2017
Company Name
Reco
CMP
Target
Mkt Cap
Sales ( Čcr )
OPM(%)
EPS (Č)
PER(x)
P/BV(x)
RoE(%)
EV/Sales(x)
(Č)
Price ( Č)
( Č cr )
FY17E
FY18E
FY17E
FY18E
FY17E
FY18E
FY17E
FY18E
FY17E
FY18E
FY17E
FY18E
FY17E
FY18E
zOthers
Hitachi
Neutral
1,394
-
3,790
2,081
2,433
8.8
8.9
33.4
39.9
41.7
34.9
33.7
28.1
22.1
21.4
1.8
1.5
HSIL
Neutral
312
-
2,253
2,384
2,515
15.8
16.3
15.3
19.4
20.4
16.1
20.2
17.4
7.8
9.3
1.1
1.0
Interglobe Aviation
Neutral
840
-
30,349
21,122
26,005
14.5
27.6
110.7
132.1
7.6
6.4
45.4
32.4
168.5
201.1
1.4
1.1
Jyothy Laboratories
Neutral
375
-
6,811
1,440
2,052
11.5
13.0
8.5
10.0
44.1
37.5
10.7
9.9
18.6
19.3
5.0
3.5
Kirloskar Engines India
Neutral
350
-
5,067
2,554
2,800
9.9
10.0
10.5
12.1
33.4
29.0
14.0
13.2
10.7
11.7
1.6
1.4
Ltd
Linc Pen & Plastics
Neutral
251
-
372
382
420
9.3
9.5
13.5
15.7
18.7
16.0
3.2
2.8
17.1
17.3
1.0
0.9
M M Forgings
Neutral
469
-
566
546
608
20.4
20.7
41.3
48.7
11.4
9.6
64.2
56.8
16.6
17.0
0.9
0.8
Manpasand Bever.
Neutral
688
-
3,937
836
1,087
19.6
19.4
16.9
23.8
40.7
28.9
4.9
4.3
12.0
14.8
4.4
3.3
Mirza International
Buy
92
107
1,106
1,024
1,148
18.0
18.0
6.9
8.0
13.3
11.4
2.3
1.9
16.6
16.3
1.3
1.1
MT Educare
Neutral
99
-
393
366
417
17.7
18.2
9.4
10.8
10.5
9.1
2.3
2.0
22.2
22.3
1.0
0.8
Narayana Hrudaya
Neutral
321
-
6,564
1,873
2,166
11.5
11.7
2.6
4.0
121.4
81.0
7.5
6.7
6.1
8.3
3.6
3.1
Navkar Corporation
Buy
161
265
2,300
369
561
42.9
42.3
7.2
11.5
22.3
14.0
1.6
1.5
7.4
10.5
7.2
4.8
Navneet Education
Neutral
143
-
3,329
1,062
1,147
24.0
24.0
6.1
6.6
23.4
21.5
4.8
4.3
20.6
19.8
3.2
3.0
Nilkamal
Neutral
1,854
-
2,767
1,995
2,165
10.7
10.4
69.8
80.6
26.6
23.0
106.0
92.0
16.6
16.5
1.4
1.2
Page Industries
Neutral
14,003
-
15,619
2,450
3,124
20.1
17.6
299.0
310.0
46.8
45.2
311.9
238.1
47.1
87.5
6.4
5.1
Parag Milk Foods
Neutral
222
-
1,865
1,919
2,231
9.3
9.6
9.5
12.9
23.5
17.1
3.6
3.0
15.5
17.5
1.1
1.0
Quick Heal
Neutral
251
-
1,758
408
495
27.3
27.0
7.7
8.8
32.4
28.5
3.0
3.0
9.3
10.6
3.5
2.9
Radico Khaitan
Accumulate
131
147
1,747
1,667
1,824
13.0
13.2
6.7
8.2
19.8
16.0
1.8
1.6
9.0
10.2
1.4
1.3
Relaxo Footwears
Neutral
419
-
5,028
2,085
2,469
9.2
8.2
7.6
8.0
55.4
52.7
21.5
18.3
17.9
18.8
2.5
2.1
S H Kelkar & Co.
Neutral
293
-
4,233
1,036
1,160
15.1
15.0
6.1
7.2
47.9
40.8
5.1
4.7
10.7
11.5
4.0
3.5
Siyaram Silk Mills
Neutral
1,661
-
1,557
1,652
1,857
11.6
11.7
92.4
110.1
18.0
15.1
2.7
2.3
14.7
15.2
1.2
1.0
Styrolution ABS India*
Neutral
605
-
1,064
1,440
1,537
9.2
9.0
40.6
42.6
14.9
14.2
38.1
34.6
12.3
11.6
0.7
0.6
Surya Roshni
Neutral
191
-
839
3,342
3,625
7.8
7.5
17.3
19.8
11.1
9.7
21.0
16.9
10.5
10.8
0.5
0.5
Team Lease Serv.
Neutral
864
-
1,477
3,229
4,001
1.5
1.8
22.8
32.8
37.9
26.3
4.1
3.5
10.7
13.4
0.4
0.3
The Byke Hospitality
Neutral
179
-
716
287
384
20.5
20.5
7.6
10.7
23.5
16.7
4.9
4.0
20.7
23.5
2.5
1.9
Transport Corporation of
Neutral
206
-
1,577
2,671
2,911
8.5
8.8
13.9
15.7
14.9
13.2
2.0
1.8
13.7
13.8
0.7
0.6
India
TVS Srichakra
Neutral
3,019
-
2,311
2,304
2,614
13.7
13.8
231.1
266.6
13.1
11.3
339.2
267.1
33.9
29.3
1.0
0.9
UFO Moviez
Neutral
407
-
1,123
619
685
33.2
33.4
30.0
34.9
13.6
11.7
1.9
1.6
13.8
13.9
1.5
1.2
Visaka Industries
Neutral
229
-
364
1,051
1,138
10.3
10.4
21.0
23.1
10.9
9.9
29.4
27.5
9.0
9.2
0.6
0.6
Stock Watch
February 27, 2017
Company Name
Reco
CMP
Target Mkt Cap
Sales ( Čcr )
OPM(%)
EPS (Č)
PER(x)
P/BV(x)
RoE(%)
EV/Sales(x)
(Č)
Price ( Č)
( Č cr )
FY17E FY18E FY17E FY18E FY17E FY18E FY17E FY18E FY17E FY18E FY17E FY18E FY17E FY18E
zOthers
VRL Logistics
Neutral
290
-
2,649
1,902
2,119
16.7
16.6
14.6
16.8
19.9
17.3
4.4
3.8
21.9
22.2
1.5
1.3
Wonderla Holidays
Neutral
373
-
2,110
287
355
38.0
40.0
11.3
14.2
33.0
26.3
4.7
4.1
21.4
23.9
7.0
5.7
Source: Company, Angel Research; Note: *December year end; #September year end; &October year end; Price as on February 23, 2017
Market Outlook
February 27, 2017
Research Team Tel: 022 - 39357800
DISCLAIMER
Angel Broking Private Limited (hereinafter referred to as “Angel”) is a registered Member of National Stock Exchange of India
Limited,Bombay Stock Exchange Limited and Metropolitan Stock Exchange Limited. It is also registered as a Depository Participant with
CDSL and Portfolio Manager with SEBI. It also has registration with AMFI as a Mutual Fund Distributor. Angel Broking Private Limited is a
registered entity with SEBI for Research Analyst in terms of SEBI (Research Analyst) Regulations, 2014 vide registration number
INH000000164. Angel or its associates has not been debarred/ suspended by SEBI or any other regulatory authority for accessing
/dealing in securities Market. Angel or its associates/analyst has not received any compensation / managed or
co-managed public offering of securities of the company covered by Analyst during the past twelve months.
This document is solely for the personal information of the recipient, and must not be singularly used as the basis of any investment
decision. Nothing in this document should be construed as investment or financial advice. Each recipient of this document should make
such investigations as they deem necessary to arrive at an independent evaluation of an investment in the securities of the companies
referred to in this document (including the merits and risks involved), and should consult their own advisors to determine the merits and
risks of such an investment.
Reports based on technical and derivative analysis center on studying charts of a stock's price movement, outstanding positions and
trading volume, as opposed to focusing on a company's fundamentals and, as such, may not match with a report on a company's
fundamentals. Investors are advised to refer the Fundamental and Technical Research Reports available on our website to evaluate the
contrary view, if any.
The information in this document has been printed on the basis of publicly available information, internal data and other reliable
sources believed to be true, but we do not represent that it is accurate or complete and it should not be relied on as such, as this
document is for general guidance only. Angel Broking Pvt. Limited or any of its affiliates/ group companies shall not be in any way
responsible for any loss or damage that may arise to any person from any inadvertent error in the information contained in this report.
Angel Broking Pvt. Limited has not independently verified all the information contained within this document. Accordingly, we cannot
testify, nor make any representation or warranty, express or implied, to the accuracy, contents or data contained within this document.
While Angel Broking Pvt. Limited endeavors to update on a reasonable basis the information discussed in this material, there may be
regulatory, compliance, or other reasons that prevent us from doing so.
This document is being supplied to you solely for your information, and its contents, information or data may not be reproduced,
redistributed or passed on, directly or indirectly.
Neither Angel Broking Pvt. Limited, nor its directors, employees or affiliates shall be liable for any loss or damage that may arise from
or in connection with the use of this information.